Demystifying U-values and their effect on the heating demand of your house
January 20, 2016
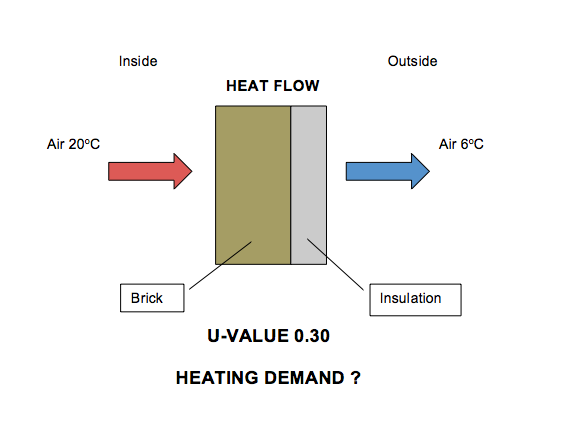
In this article we are going to figure out the effect of U-values on the heating demand of your home. By adding insulation to the walls of your home, you reduce the U-value and in turn you will save money on your heating energy bills. Let see how this works.
The heat demand of your house depends on a number of factors such as:
The insulating properties of the fabric of your house, known as U-values of the walls
The amount of heat carried out of your house by air movement, depending on how big your house is and the number of windows
The difference between the inside and outside temperatures – the heat requirement for a home varies from season to season (more heat is needed during the winter months for example).
A better way to estimate the annual space heat consumption is to divide the heating into periods for different outside temperatures, such as mid-season and winter. For example, during winter the average outside temperature is 6oC while the inside temperature is set to 20oC to stay comfortable. For a standard temperature difference and constant heat losses through ventilation, the amount of heating required depends on the insulation of the walls, roof and floor. In the next section we are going to examine how insulation affects the heat transfer through the walls.
Common cavity walls built after 1930s consist of two layers of brick of about 100mm each separated by an air cavity of 70mm in the middle as you see in the picture below.
The u-value of an Un-insulated Wall
Layers
Thickness (m)
Conductivity (W/mK)
Resistance (Km²/W)
Internal surface
–
–
0.12
100 mm Brick
0.100
1.2
0.08
Air
0.070
–
0.17
100 mm Brick
0.100
1.2
0.08
External surface
–
–
0.06
Sum
0.270
–
0.52
U value (W/m²K)
1.94
The insulation commonly used in cavity walls like this is EPS (such as Polypearl Plus and Polypearl Platinum) – this is expanded polystyrene bead which helps to reduce the thermal transmittance of the external cavity walls. By adding 70mm of Polypearl Platinum insulation to your cavity wall you can reduce the U-value from 1.94W/m²K to 0.41W/m²K.
The u-value of a cavity wall insulated with Polypearl Platinum (EPS Insulation)
Layers
Thickness (m)
Conductivity (W/mK)
Resistance (Km²/W)
Internal surface
–
–
0.12
100 mm Brick
0.100
1.2
0.08
70mm Polypearl Platinum
0.070
0.033
2.12
100 mm Brick
0.100
1.2
0.08
External surface
–
–
0.06
Sum
0.270
–
2.47
U value (W/m²K)
0.41
The u-value of an Uninsulated Solid Wall
Solid Walls commonly consist of a brick layer of 250mm thick. Most houses built before the 1930s (and many blocks of flats up to the 1950s) have solid walls without any insulation – these tend to suffer from large heat losses with U-values reaching as high as 2.58W/m²K.
Layers
Thickness (m)
Conductivity (W/mK)
Resistance (Km²/W)
Internal surface
–
–
0.12
250 mm Brick
0.250
1.2
0.21
External surface
–
–
0.06
Sum
0.250
–
0.39
U value (W/m²K)
2.58
Insulated Solid Wall
By adding 100mm of mineral wool or expanded polystyrene (EPS) in your solid walls you can reach a U-value of 0.31W/m²K and 0.28W/m²K, respectively.
Mineral wool insulation
Layers
Thickness (m)
Conductivity (W/mK)
Resistance (Km²/W)
Internal surface
–
–
0.12
250 mm Brick
0.250
1.2
0.21
100mm Mineral wool
0.100
0.035
2.86
External surface
–
–
0.06
Sum
0.350
–
3.25
U value (W/m²K)
0.31
EPS
Layers
Thickness (m)
Conductivity (W/mK)
Resistance (Km²/W)
Internal surface
–
–
0.12
250 mm Brick
0.250
1.2
0.21
100mm EPS
0.100
0.032
3.13
External surface
–
–
0.06
Sum
0.350
–
3.51
U value (W/m²K)
0.28
What is the impact on U-value of adding even more insulation to walls?
In the table we have figured out the reduction of the U-values by adding different thicknesses and types of insulation in a solid brick wall and a cavity wall. As you can see there is no need to go for insulation thickness higher than 100mm as you can reach the U-values required to meet building regulations.
COMMON BRICK (250mm)
Insulation Thickness (mm)
U-value (W/m2K)
UNINSULATED WALL
–
2.58
EPS
50
0.51
100
0.28
150
0.20
Mineral wool
50
0.55
100
0.31
150
0.21
CAVITY WALL
Insulation Thickness (mm)
U-value (W/m2K)
UNINSULATED WALL
–
1.94
Polypearl Platinum
50
0.54
70
0.41
150
0.20
Polypearl Plus
50
0.59
70
0.45
150
0.23
What practically a reduction of the U-value means?
Heat transfer between indoor and outdoor
This is an example to help you understand how U-values affect the heat losses of your walls.
The heat loss through the walls can be described by the equation:
Fabric Heat loss through the walls = Σ UxA x ΔΤ, where
Σ UxA is the sum of the products of the U values and areas of all parts of the external envelope of the building,
ΔΤ is the difference between external and internal temperatures
So, for 1m2 of solid un-insulated wall and 20oC – 6oC = 14oC = 14K the heat loss would be 2.58 W/m2K x 14 K = 36.12W/m2 as can be seen in the next table.
U value (W/m2K)
ΔΤ (K)
Heat Demand (W/m2)
Reduction of heat losses (W/m2)
Un-insulated wall
2.58
14
36.12
–
Mineral wool insulation
0.31
14
4.34
31.78
EPS insulation
0.30
14
3.92
32.20
By adding insulation e.g.. mineral wool there would be a reduction of 2.58 – 0.31 = 2.27 W/m2K in the U-value of the solid wall. Smaller U-values practically means a reduction in heat loss of 31.78W/m2.
We should also take into account the air leakage of your house to estimate the heat demand of your house. For example, for an average semi-detached house of 98 m2 with a total volume of 245 m3 the heat loss coefficient is cf = 304.02 W/K for un-insulated wallsand standard U-values for the windows, floor and roof as you see in the next table. For the same house, the ventilation loss coefficient cv = 65 W/K. By insulating the wall with mineral wool the fabric heat losses will be reduced to cf = 202.03 W/K.
If you heat your house with gas (4.36p per KWh), this practically means that you will have saved about 0.01907KWh/m2 x £0.0436/KWh = £0.00083145/m2 per hour. During the heating season, if you heat your house for 7 hours you will save about £0.0058/m2 per day. So, for the whole heating period of approximately 3 months you will save £0.524/m2. For an average house of 98m2 this means that you save £51.35 to heat your house by adding mineral wool insulation to your solid walls.
U value (W/m2K)
ΔΤ (K)
Reduction of heat losses (W/m2)
Save (£)
Mineral wool insulation
0.31
14
31.78
51.35
EPS insulation
0.30
14
32.20
52.90
In reality, in order to give a more accurate estimation of the heat demand we should take into account the heat gains from the lights and electrical appliances of your home, and the heat produced by the occupants and the solar heat gains mainly through windows. So, actually the heating loads will be a little bit less than calculated in this example – the difference between the heat losses and the heat gains.
2015 Climate Change Conference in Paris
December 16, 2015
The 2015 United Nations Climate Change Conference (COP 21 or CMP 11) was held in Paris, France, from 30 November to 12 December 2015. It was the 21st yearly session of the Conference of the Parties (COP) to the 1992 United Nations Framework Convention on Climate Change (UNFCCC) and the 11th session of the Meeting of the Parties to the 1997 Kyoto Protocol (CMP).
196 parties attended the conference to negotiate the Paris Agreement which is aiming to reduce climate change. Climate change seems to be the most important issue facing our planet today as stated by more than 150 world leaders that attended the conference including Presidents Obama, Putin and Xi.
Climate Change Prediction
Change in average surface temperature (1986−2005 to 2081−2100), Source: IPCC 2014, Synthesis Report
According to the IPCC’s 2014 Synthesis Report, if greenhouse gas emissions continue to rise at the same rate throughout the 21st century, the surface temperature is projected to rise up to 11 degrees Celsius. This will result to increased heat waves and precipitation events that will last longer and be more intense and severe. Sea levels will rise dramatically and cause the elimination of many species.
Goal of Paris 2015
The goal was to reach an agreement to limit the global temperature increase to 2 degrees Celsius compared to pre-industrial levels by reducing greenhouse gas emissions. The greenhouse gases are the main cause of global warming, two times more harmful than man-made aerosols, solar energy and volcanic activity.
To reach this goal the greenhouse gas emissions have to be limited to a net zero level sometime in the second half of the 21st century. France takes the lead in this attempt being one of the few developed countries in the world that from 2012 have managed to generate over 90% of its electricity from zero carbon sources, including nuclear, hydroelectric and wind.
Top 3 Emitting Regions
The top 40 CO2 emitting countries across the world in 1990 and 2012, including per capita figures. The data is taken from the EU Edgar database
The role of China, U.S. and Europe is of great importance to reach this goal, as together they are the top 3 emitting regions in 2012, accounting for more than half of the total CO2 emissions globally. During the last two decades, from 1990 to 2012, China and the United States increased their CO2 emissions while Europe managed to decrease this percentage.
Suggested Commitments
Prior to the conference, the so-called Intended Nationally Determined Contributions (INDCs) were published in a series of proposals to be achieved during the next decades. The suggested commitments were to:
Limit global warming temperature increase to 2.7 degrees Celsius by 2100
Reduce greenhouse gases emitted by human activity by 40% by 2030 compared to 1990
To review each country’s contribution to cutting emissions every 5 years beginning in 2023
To help poorer nations to adapt to climate change and switch to renewable energy
Outcome
On 12th December 2015, 195 of the participating countries agreed by consensus to the Paris Agreement to reduce emissions as part of the method for reducing greenhouse gas emissions. Τhe members of the conference agreed to take action in order to reduce their carbon output and to do their best to keep global warming below 2 degrees Celcius. France’s Foreign Minister Laurent Fabius said this “ambitious and balanced” plan was a “historic turning point” in the goal of reducing global warming.
The agreement will become legally binding if joined by at least 55 countries which together represent at least 55 percent of global greenhouse emissions. Such parties will need to sign the agreement in New York between 22 April 2016 to 21 April 2017, and also adopt it within their own legal systems. However, there remain doubts as to whether the good will of the past few weeks will carry over to the US next year.
Think we missed something? Do you have a different opinion?
Comment below to get your voice heard…
How much energy does my home use?
November 9, 2015
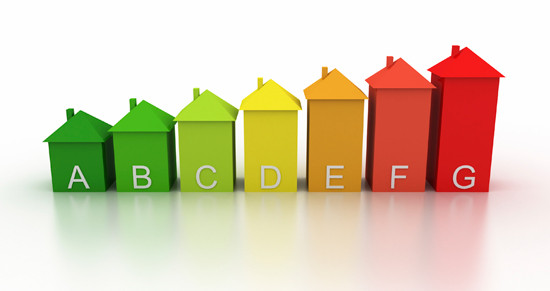
Estimating how much energy a home uses
Domestic buildings are responsible for 30-40% of primary energy use in the UK. When talking about primary energy use, we tend to be referring to electricity and gas, although some properties use oil or other means for heating. Electricity in the home tends to be used for lighting, cooling systems (AC unit) and electrical appliances while gas is normally used for heating and hot water generation. Energy is used 24/7, all year round, as most homes have background appliances running all the time.
It is said the average home in the UK has an average energy bill of £1,326 per year – which is split between electricity and gas.
This ‘average house’ phrase is used all the time in the energy industry – and more and more often we are subjected to it in the media too – but what exactly is an average house?
Perhaps more importantly we are going to look at how homes vary from the average – the housing stock in the UK is so diverse, not many of us are going to find ourselves living in an average home – so we hope having read this you can perhaps tailor the meaning of this average home to make it slightly more specific to your home!
The most common type of dwelling here in the UK is a three bed semi-detached property – with 2-3 occupants. The average home comprises of a living room, kitchen, bathroom and 2 or 3 bedrooms. The average home tends to have been built from solid brick 220mm walls (instead of cavity walls), double or single glazing with modest loft insulation and some form of central heating system.
According to RIBA (The Case for Space: the size of England’s new home, Royal Institute of British Architects, September 2011) a survey of a sample of 3,418 homes across 71 sites concludes that an average three-bedroom home has a internal floor area of approximately 88m2.
Average energy cost for a home
In the period between November 2014 and October 2015, the annual average dual fuel customer bill in the U.K. was £1,326 as can be seen in the table below (source: Ofgem). According to the Department of Energy & Climate Change (DECC), in 2014 the average domestic electricity consumption per UK household was 4,000kWh and the average domestic gas consumption per UK household was 12,400kWh.
As we mentioned, most people don’t fall into this average home. In order to make a more accurate estimation of the energy usage of your own home we need to take into account several different parameters – they are as follows:
The type, size and age of your home
The location and weather
The heating and cooling type
The levels of wall, floor and loft insulation
The external wall area and windows area
The efficiency of the appliances and lighting
The occupancy
The users’ status and lifestyle
In the next section we explore a little bit into the variables that determine the energy usage of a home. This will hopefully put into context some of the research published in this area and what we talked about at the top of the article.
The location and weather
To estimate the heating loads of a house we should take into account the difference between the inside and outside temperatures. So, the total heat losses of the house are therefore determined by the fabric and ventilation heat losses. The fabric heat losses can be calculated working out the surface of the exposed external walls and then calculating the u-values of each element. The ventilation losses depend on the cubic volume of each room and the air changes per hour through open windows and other forms of infiltration.
For example, the fabric heat loss coefficient of an average semi-detached 2-storey house of medium size (Total floor area: 98m2, Total window area 8m2 South and 8m2 North) can be given by the next equation:
cf = Σ UxA (W/K) where,
cf is the fabric heat loss coefficient,
Σ UxA is the sum of the products of the U-values and areas A of all parts of the external envelope of the building
Length (m)
Width (m)
Area (m2)
Height of Ceiling(m2)
Volume(m3)
1st floor
7
7
49
2.5
122.5
2nd floor
7
7
49
2.5
122.5
Total
98
245
So, external wall area: 3sides x 7m length x 2floors x 2.5m height = 105m2
If we remove the area of windows the total external wall area will be: 105m2 – 16m2 =89m2
Given the typical U-values of such a house we will have the next table:
Element
Area (m2)
U-value (W/m2/K)
A.U (W/K)
Wall
89
0.45
40.1
Windows (8m2 South, 8m2 North)
16
2.50
40.0
Floor
49
0.45
22.1
Roof
49
0.25
12.3
TOTAL
203
114.5
The fabric heat loss coefficient is cf ≈ 115 W/K
The ventilation loss coefficient will be:
cv = (ac/h x Volume of building / 3) (W/K) where,
cv is the ventilation loss coefficient,
ac/h is the air changes per hour (0.8 ac/h for single-glazed windows and old frames)
The volume of house is: 49 x 5 = 245 m3
So, cv = 245 x 0.8 / 3 ≈ 65 W/K
To calculate annual space heat demands we have to add up daily heat demands over the whole of the space heating season. So, the annual space heat demand of a building is given by the next equation:
Annual space heat demand = (24/1000) x (cf + cv) x degree-days (kWh) where,
degree-days are the number of days when the average outside temperature is lower than a base temperature above which a building needs no heating.
The degree-day figures normally assume a balance temperature or degree-day base temperature of 15.5°C. As can be seen in the next map, the value for London is approximately 2100 Degree days, for Newcastle 2400 and for Plymouth 1900. This figure is supposed to be representative of most dwellings, but for very well insulated dwellings and many commercial buildings it is too high, and leads to significant overestimates of annual space heat demand.
Figure 5: Degree Days map of UK based on 15.5°C
The next table shows the space heating demand for 3 different UK locations. Notice that this is the price for space heating only and not for the total gas consumption that comes from the hot water and cooking too.
Degree-days
Annual space heat demand
Cost for heating
Newcastle
2,400
10,368 kWh
£363
London
2,100
9,072 kWh
£318
Plymouth
1,900
8,208 kWh
£287
* Gas unit price is taken as 3.50p/kWh
The space heating type
The main sources of heating are gas and electricity, but some homes are heated by oil and even biomass pellets. Most homes have condensing gas boilers and a typical seasonal efficiency on those units is approximately 87% over a heating season (for condensing boiler types), but you may well have an air source heat pump or a biomass boiler so the efficiencies will vary a huge amount. Non-condensing gas boilers have efficiency between 0.65 and 0.70. We will now use the gas boiler example to demonstrate how to calculate the useful heating required for your home.
To calculate the space heating required take the gas consumption for the home in kWhs (you can look at your annual gas bill statement) and then divide this figure by the average efficiency of your heating system.
For example, for an average house like we described previously located in London, to reach the required space heating demand of 9,072 kWh the energy consumption is:
For a condensing boiler: 9,072 kWhs of gas/ 0.87 SPF = 10,428 kWh for this particular house, assuming continuous heating throughout the heating season (the six months around Christmas).
For a non-condensing boiler: 9,072kWhs of gas/ 0.65 SPF = 13,957
Type of Boiler
Required space heating (kWh)
Boiler efficiency
Energy consumption (kWh)
Condensing Boiler
9,072
87%
10,428
Non-condensing Boiler
9,072
65%
13,957
Save
3,529
According to Sedbuk, the annual fuel costs for different boiler types is:
Boiler Type
Flat
Semi-detached
Detached
Boiler Efficiency
Old gas heavy weight
£779
£1204
£1705
55%
Old gas light weight
£659
£1019
£1442
65%
New non-condensing
£549
£849
£1202
78%
New condensing
£481
£744
£1053
89%
*These figures are based on a gas unit price of 4.36p per kWh (April 2013)
Quality of wall, floor and loft insulation
The average energy performance score (determined by the EPCs) of the UK is SAP60, which puts it into a band D. At SAP60 the insulation quality of a home can be described as moderate with areas that could certainly be improved. There are millions of homes though that have a far lower SAP energy score though – particularly homes built before 1930, when insulation quality wasn’t really a consideration.
Below we look at a home with some of the typical characteristics including the property fabric, quality of insulation and information on the heating system.
This is a typical semi-detached house with 4 habitable rooms, built between 1930 and 1949 with solid brick walls. There is no wall insulation and very little in the loft. The windows are double-glazed. The central heating system uses gas and the total area of a house is 100m2 and is occupied by 4 people.
This type of house would have the following kind of SAP information
We ran some numbers through the RDSAP calcualtion method, and the typical household energy bill for such a house is £1,576, 65% of this spent for electricity and 35% for gas. Given the prices for electricity and gas, 12.5p/kWh and 3.5p/kWh respectively, this house consumes 4,413kWh for electricity and 29,269kWh for gas per year.
Figure 5: Façade of a common detached maisonette
Figure 6: Floor plans of a common detached maisonette
The external wall area and windows area
The type of glazing and the frame type are responsible for the heat losses through the windows. Most of the UK houses have already replaced the old single-glazed windows and frames and they are now double-glazed. The ventilation and infiltration rate through the glazing and the frames is calculated given the volume of the house and the air changes per hour.
So, for an average UK house with double-glazed windows the air changes per hour are 0.8-1.0 and for double-glazed windows are 0.3.
ACH
Ventilation loss coefficient cv
Required space heating (kWh)
Single-glazing
0.8
65
9,072
Double-glazing
0.3
24.5
7,031
Save
2,041
The efficiency of the appliances and lighting
A typical 3 bedroom semi-detached house has about 10 lights, each of them consuming 50W of electricity. So, each hour they spend 500W and the total energy for an average use of 4 hours per day is 2kWh. In the UK the cost of electricity is approximately 13p/kWh, therefore, the cost per day is £0.26 and the annual cost for 365 days is £95.0.
By replacing all of the incandescent light bulbs with LED lights the cost would be reduced to £9.5. So, you would have a reduction of 90% in your electricity consumption for lighting. Taking into account that lighting and home appliances tend to account for 20% of a typical energy bill this investment will save a significant amount of your money.
The heating and cooling loads of a home are influenced by the internal gains of the people who live at the house. At the same time, the more the occupants the more energy usage of the house appliances is being made.
The users’ status and lifestyle
Ofgem suggest the following for yearly energy consumption by user group:
Low User (kWh)
Medium User (kWh)
High User (kWh)
Electricity
2000
3200
4900
Gas
9000
13500
19000
Economy 7
2700
4600
7800
Table 2: Energy consumption of each energy user group according to Ofgem
An average ‘medium user’ is defined in terms of energy use, as using 3,100 kWhs of electricity a year and 12,500kWhs of gas a year. As we stated previously, this kind of property describes a medium sized property, with three bedrooms occupied by 3 to 4 people (for example 2 adults, 2 children). During the day children are at school and parents at work, and everyone comes at home in the evening. They house appliances’ usage is a few times a week for the washing machine, regular heating, occasional dishwasher, TV and electrical appliances in the evenings, as can be seen in the next figure.
Figure 7: Three main categories of energy users according to Ofgem
To sum up, for different types of UK house the energy consumption is as follows, as calculated by using the Stroma RSAP program:
Type of House
Age
No Rooms
No Storeys
Size
Area (m2)
Electricity (kWh)
Gas (kWh)
Total Price (£)
Mid Terrace
1900-1929
3
2
Small
70
3760.4
24941.4
1343
4
2
Medium
93
4289.6
28451.4
1532
6
2
Large
116
4855.2
32202.9
1734
End terrace
1900-1929
3
2
Small
70
4816
31942.9
1720
4
2
Medium
93
5311.6
35230.0
1897
6
2
Large
116
5838
38721.4
2085
Detached
1983-1990
3
2
Small
80
3029.6
20094.3
1082
4
2
Medium
100
3472
23028.6
1240
6
2
Large
120
3911.6
25944.3
1397
Semi-Detached
1930-1949
3
2
Small
80
3911.6
25944.3
1397
4
2
Medium
100
4412.8
29268.6
1576
6
2
Large
120
4916.8
32611.4
1756
Flat
1967-1975
2
1
Small
40
2578.8
17104.3
921
3
1
Medium
60
3082.8
20447.1
1101
4
1
Large
80
3626
24050.0
1295
Table 3: Annual consumption for different house types
You can save money from your energy bills by either reducing your existing energy demand or using renewable energy, or with a combination of them. Applying one or more of the next methods in your property can reduce the domestic energy consumption:
Wall and loft Insulation
Double glazing
Draught proofing
More efficient boiler
More efficient light bulbs
Low consumption house appliances
Thermostats
Home automation systems
The Renewable energy systems include:
Solar Pvs or Solar thermal
Biomass
heat pumps
Mechanical ventilation in buildings – what you need to know
October 9, 2015
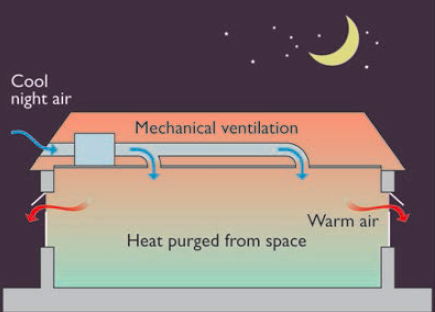
How do we deal with hot weather in the UK or getting rid of latent warm air without spending huge amounts of energy and money on air-conditioning systems? Although natural ventilation is the commonly low-cost practice to cool a building efficiently during the summer, mechanical ventilation in theory appears to be more efficient due to several reasons that are explored in this article.
Mechanical Ventilation advantages over natural ventilation
Mechanical ventilation can be retrofitted to almost every house and a large number of commercial premises to promote fresh air into spaces and then remove any latent heat. As previously discussed (reference to natural ventilation article), natural ventilation is based providing fresh air to a building through openings such as windows and doors. The way it works will depend on the type of the openings and the layout of the building.
Excessive solar gain and cooling with natural ventilation
The big issue with natural ventilation is that with glazing causes solar gain and in the summer months if this is excessive, it can cause local discomfort. In this case, mechanical ventilation would be more effective because it provides a more homogeneous effect due to a more even distribution of air.
The other issue with natural ventilation is that it can lead to excessive cooling capacity of rooms and again this may be worse / better depending on the building layout.
Mechanical ventilation reduces noise and air pollution
Mechanical ventilation is the only option when the building is located in noisy areas or in areas where the local air quality is poor, and therefore the use of openable windows for natural ventilation is not a practical solution. It is worth noting that security considerations may also lead to the use of mechanically assisted ventilation in many buildings as it allows the units to be securely locked.
However mechanical ventilation can be a costly solution
Mechanical ventilation definitely has merits over natural ventilation, but the issue comes to retrofitting a solution to a building, which could add quite a bit to the cost. This is why if possible mechanical ventilation is designed into the building plans, so that the costs to implement kept to a minimum.
Also, many companies lease the buildings that they occupy, so the decisions about the facilities management are taken out of their control. Landlord in turn would find it hard to invest in a system that would require significant funds but not so obvious quantifiable benefits.
The next section deals with some of the practical mechanical ventilation solutions and brief explanations on how they actually work.
Mechanical Ventilation Solutions
The simplest forms of mechanical ventilation systems simply circulate the air at the ceiling level, for example ceiling fans. They create air movement at the ceiling level to cool the space.
We may also have roof ventilators with louvers that help cold air enter the house and warm air to be exhausted as can be seen in Figure 1.
Figure 1: Example of roof ventilators (BSRIA BG 2/2005)
The roof ventilators can also be solar assisted to enhance the stack effect by increasing the air temperature in the top of the house. As mentioned before in natural ventilation the stack effect is based on temperature difference within the space and the outside air – the hotter it is at the top of the building the quicker the latent warm air is allowed to escape.
Ducts can be used to supply air to different levels of a multi-storey building, using underfloor or displacement ventilation that provide fresh air from floor-mounted or low-level wall mounted ventilators within the occupied rooms or zones.
Figure 2: Typical air flow pattern of displacement ventilation
In addition ventilated façade systems that are installed in the window frames such as those that can be seen in Figure 3 can also be classed in the mechanical ventilation family.
Figure 3: Ventilated facade system
Supply and extract systems
Fan-assisted extracts work by enhancing the air movement to exhaust latent heat when the internal temperature is high.
Mechanical ventilation systems can have both supplier and extract vents assisted by fans as can be seen in the next se of figures. These systems may also include filters to ensure a higher standard of indoor air quality, coupled with heating and/ or cooling coils. When installing these systems they need to be ideally positioned into spaced to take into account occupational density and well as tackling cold draughts.
Figure 4a: Supply and extract systems with re-circulation
Figure 4b: Supply and extract systems incorporating indirect heat recovery
Mechanical extract only systems are used mostly when the air becomes contaminated such as in kitchens, bathrooms etc – where there is a need for constant and predictable extraction of air. Supply only systems are suitable for houses and occupied offices that need to be supplied by fresh air when the air movement needs to be controlled.
Figure 5: Fan-coil unit with direct fresh air supply through external wall
Other mechanical ventilation systems
Another option for mechanical ventilation systems is to go for mixed-mode ventilation where the system works in conjunction with natural ventilation. It corresponds well to the operational performance of the occupied buildings providing indoor air quality and preventing summer overheating.
Mixed mode ventilation can reduce annual energy use by over 41% with 19% of this reduction is due reduced night cooling of the building. Night ventilation is enhanced by mechanical systems that ensure an adequate level of airflow to remove heat gains during night.
Figure 6: Mechanically assisted night ventilation
Summary of mechanical ventilation
To sum up, the main reasons why mechanical ventilation wins over natural ventilation:
The layout buildings does not help natural ventilation because the spaces are too deep to be ventilated from the perimeter or the air paths are being mitigated by the internal partitions.
Natural ventilation absorbs any poor local air quality if present whereas mechanical ventilation can filter these pollutants out.
Mechanical ventilation will allow less noise pollution to enter the building via openings such as windows.
Highly dense areas will not have enough wind velocity to pump enough air flow into a building.
Mechanical ventilation increases security as the building unit can be more sealed.
Some of the mechanical ventilation solutions explored
Roof ventilators
Ducts to encourage underfloor or displacement ventilation
Ventilated façade systems
Supply and extract systems
Mixed mode ventilation
Cost / benefit of mechanical ventilation
Mechanical ventilation if designed into the plans of the building is a great concept – however to retrofit a solution may be too expense to implement.
Reference: BSRIA, The Illustrated Guide to Mechanical Building Services
This website uses cookies. By continuing to use our website you agree to our Data Protection Policy, which you can view here.OK
Privacy & Cookies Policy
Privacy Overview
This website uses cookies to improve your experience while you navigate through the website. Out of these, the cookies that are categorized as necessary are stored on your browser as they are essential for the working of basic functionalities of the website. We also use third-party cookies that help us analyze and understand how you use this website. These cookies will be stored in your browser only with your consent. You also have the option to opt-out of these cookies. But opting out of some of these cookies may affect your browsing experience.
Necessary cookies are absolutely essential for the website to function properly. This category only includes cookies that ensures basic functionalities and security features of the website. These cookies do not store any personal information.
Any cookies that may not be particularly necessary for the website to function and is used specifically to collect user personal data via analytics, ads, other embedded contents are termed as non-necessary cookies. It is mandatory to procure user consent prior to running these cookies on your website.