In the following article I am going to take a some of the key energy industry facts and figures, I have tried to pull the relevant information out and then present this is a fairly basic format. I hope once you have finished reading through it, it will present you with a fairly compelling case of where the UK should be headed in terms of energy policy, but hopefully it also makes you aware of some of the other issues that consumers are no doubt going to face in near future. Please feel free to comment below and I have tried to reference where I can!
Consumer Energy Bills
Key Facts & Figures
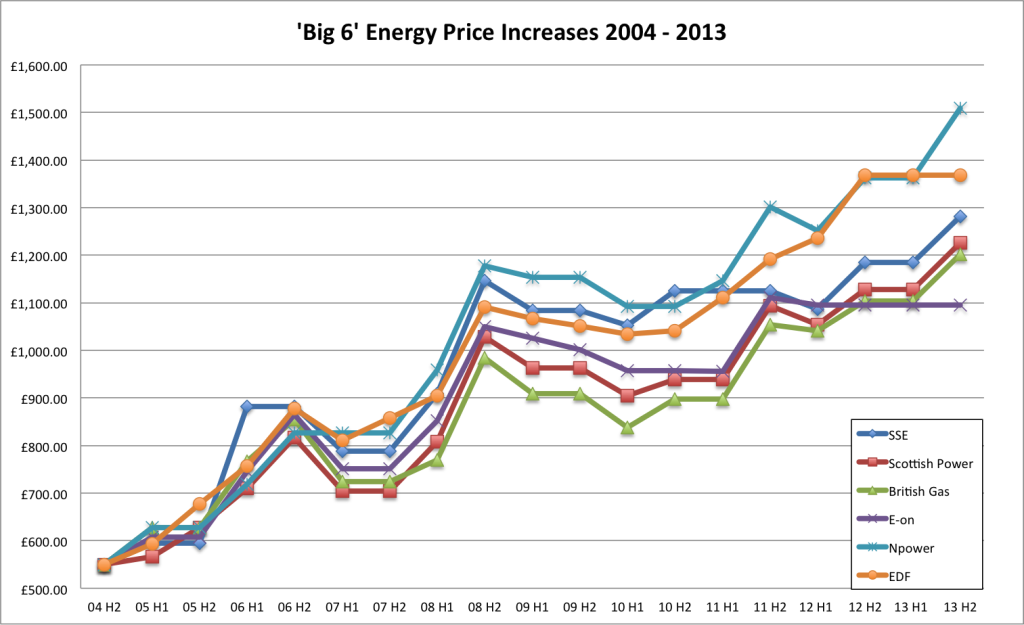
- The average UK energy bill in 2005 – £580
- The average UK energy bill in 2013 – £13851
- The average UK energy wholesale component of the 2005 bill was £376
- The average UK energy wholesale component of the 2013 bill was £610
- The ‘Big Six’ energy company make a profit of £53 per customer (before the recent price rises taken in to account) – this equates to a profit margin of 4.3%.
Key discussion Points
- Why are energy bills going up so aggressively when the underlying energy wholesale prices are not rising at nearly such an extent (This is what energy companies are blaming bill increases on).
- How do the energy companies justify their profits – why should they turn a profit as a matter of course each year?
- You can see what makes up your energy bills here.
The UK Energy Mix
Key Facts and Figures
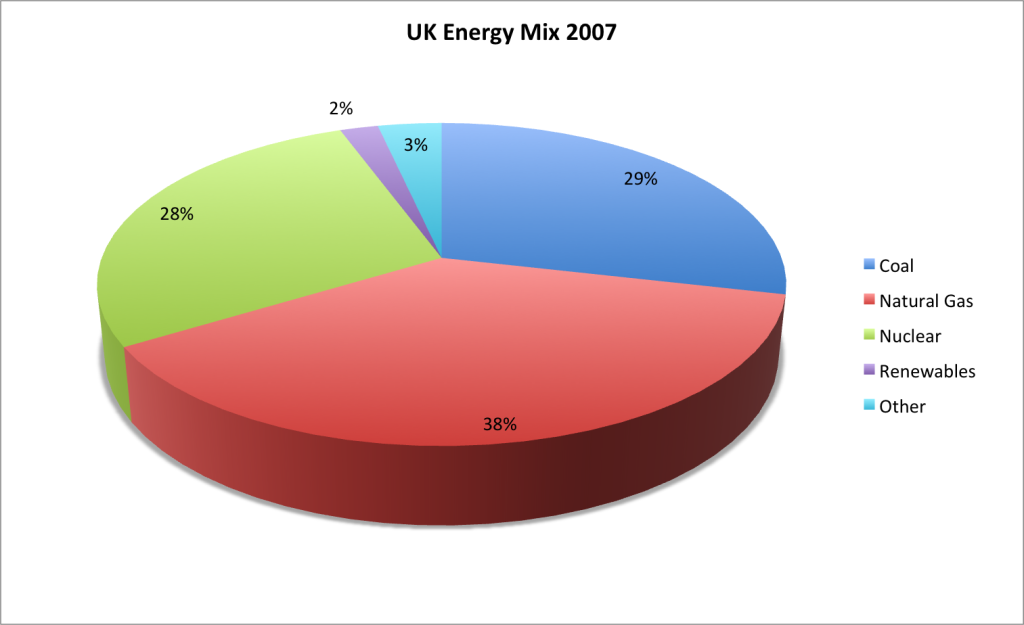
The following pie chart shows the UK energy mix in 2007. 2
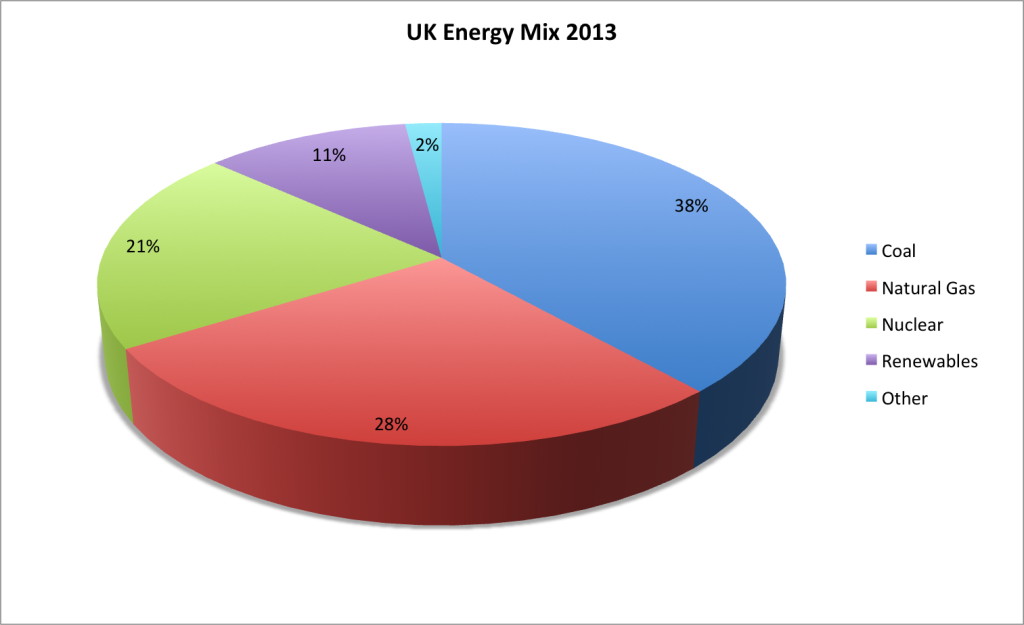
This graph shows the energy mix that we have in the UK today. 2
 The CO2 emissions from each fuel type within the energy mix are shown below.
- Coal – 910g/kWh
- Natural Gas – 390g/kWh
- Nuclear – 0g/kWh (although radioactive waste produced)
- Renewables – 0g/kWh
- Other – 590g/kWh
Key discussion Points
- The amount of energy we need to import is rising at an alarming rate and much of this is imported from politically volatile corners of the globe – should we not try and minimise imports by installing our own generating capacity? (Take the Severn Barrage for example which could provide 5% of the UK’s energy requirement and is predictable enough to be used to supplement UK base load).
- We are now burning considerably more coal than just 5 years ago – this is mostly due to the import prices falling as a result of US shale gas, but is this not a backward step from where we were? Burning coal produces about three times as much CO2 than burning gas.
- We are now producing 10% of our energy from Renewables – if we weren’t then the amount of imported fuel would surely be higher?
Fuel Poverty
Key Facts & Figures
- The number of people in fuel poverty under the old definition – 3.2m
- This is defined as the number of households in the UK that pay more than 10% of their income on fuel to maintain an adequate level of warmth
- The number of people in fuel poverty when the definition changes at the end of 2013 – 2.4m
- This new definition states energy poverty as the number of households which need to spend more than average on fuel to keep warm and who would be left with “a residual income below the official poverty line” if they did.
- The Office of National Statistics estimated 31,100 excess winter deaths in England in Wales during 2012-2013 and of those, 9,000 are believed to have died because they were living in freezing homes.
Key discussion Points
- The UK is considered as a 1st World county – how do we find ourselves in a position where so many people are dying as a direct consequence of not being able to heat their homes – yet energy companies who supply this energy are still allowed to make a 5% profit.
- This is just a personal bugbear, but why do the Government always change the way of reporting things so they can paint a brighter picture? In the history of politics have a Government ever changed their definitions to paint a more accurate picture? Google ‘things excluded in UK unemployment numbers’ if you want to see this in action!
Energy Efficiency
Key Facts and Figures
- Studies of different energy efficiency programmes show costs range from £8 to £40 to save a MWh of electricity, this compares to around £80 to generate a MWh of electricity using a gas-fired power station.3,4
Insulating Cavity Walls
- Cavity Wall Insulation costs approximately £8/m2 to install.
- Cavity Wall Insulation should save you £2/m2 of wall once installed per year.
- Payback on cavity wall insulation should be 4 years.
- No. of homes with cavity walls still to be insulated – 5.75m
Insulating Loft spaces (going from 0mm to 270mm)
- Loft insulation costs approximately £5.70/m2 to install
- Loft insulation should save you £4.0/m2 once installed per year
- Payback on loft insulation should be a little over a year.
- No. of homes with lofts still to be insulated – 7.59m
Key discussion Points
- It is far cheaper to make homes more energy efficient and therefore reduce demand rather than build new capacity, so why is the UK reworking ECO to reduce its impact?
- Surely it would be a sensible to put a target in to insulate all lofts and cavities by the end of 2015 (when coal power plants begin to shut and headroom between generating capacity and demand to the point blackouts may become an issue).
- Should energy efficiency be linked to council tax to incentivise people to adopt energy efficiency solutions?
And just to finish, ahead of this weeks Autumn Statement announcement, I have attached three of David Cameron’s choice quotes on energy efficiency and its importance, the most recent was in February 2013.
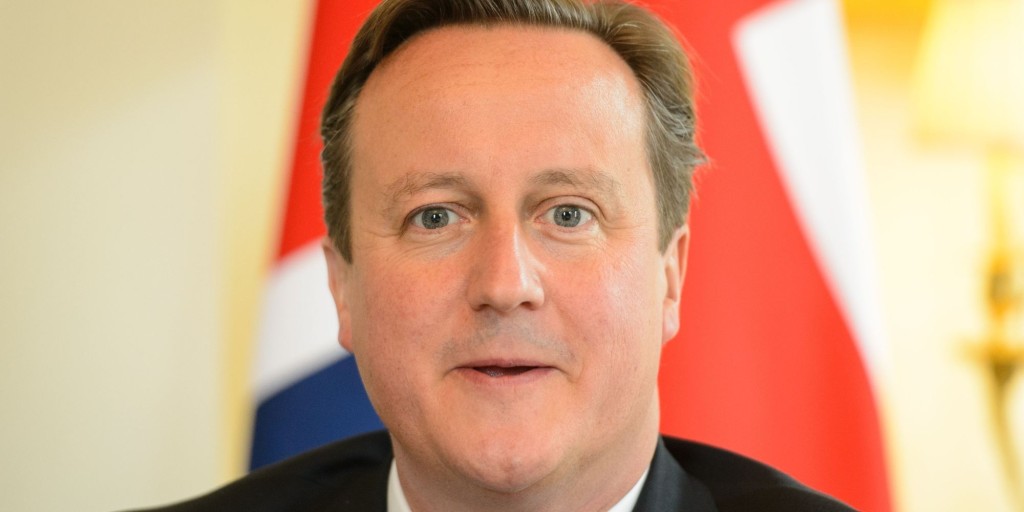 Upon visiting the WWF research station in Norway – 2006
“Climate change is one of the biggest threats facing the world and we must have a much greater sense of urgency about tackling it.”
Speech to DECC officials – May 2010
“We’ve got a real opportunity to drive the green economy to have green jobs, green jobs and make sure we have our share of the industries of the future…I want this to be the ‘greenest government ever”
Prime Minister’s address at the launch of the DECC’s energy efficiency mission – Feb 2013
“To those who say we just can’t afford to prioritise green energy right now, my view is we can’t afford not to.
Far from being a drag on growth, making our energy sources more sustainable, our energy consumption more efficient, and our economy more resilient to energy price shocks – those things are a vital part of the growth and wealth that we need.
Already today Britain is one of the best places for green energy, green investment, and crucially for green jobs anywhere in the world”
References
- https://www.ofgem.gov.uk/gas/retail-market/monitoring-data-and-statistics/electricity-and-gas-supply-market-indicators
- https://www.gov.uk/government/publications/fuel-mix-disclosure-data-table
- http://webarchive.nationalarchives.gov.uk/+/http://www.berr.gov.uk/whatwedo/energy/markets/electricity-markets/fuel-mix/page21629.html
- http://www.policyexchange.org.uk/images/publications/smarter%20greener%20cheaper.pdf
- https://www.gov.uk/government/uploads/system/uploads/attachment_data/file/65713/6883-electricity-generation-costs.pdf






Cameron is ammoral. Cushioned from normal reality, he has no religion, no spirituality and is easily turned by his vicious, greedy supporters.
Excellent summary of this industry. It certanly is soberingand saddening to see coal burning increase by almost a quarter and how this in no way agrees with this government’s claim about their being the “greenest government ever”.
i like this websie