Estimating how much energy a home uses
Domestic buildings are responsible for 30-40% of primary energy use in the UK. When talking about primary energy use, we tend to be referring to electricity and gas, although some properties use oil or other means for heating. Electricity in the home tends to be used for lighting, cooling systems (AC unit) and electrical appliances while gas is normally used for heating and hot water generation. Energy is used 24/7, all year round, as most homes have background appliances running all the time.
It is said the average home in the UK has an average energy bill of £1,326 per year – which is split between electricity and gas.
This ‘average house’ phrase is used all the time in the energy industry – and more and more often we are subjected to it in the media too – but what exactly is an average house?
Perhaps more importantly we are going to look at how homes vary from the average – the housing stock in the UK is so diverse, not many of us are going to find ourselves living in an average home – so we hope having read this you can perhaps tailor the meaning of this average home to make it slightly more specific to your home!
So first then – what is an average home?
Determining the size of a typical home
The most common type of dwelling here in the UK is a three bed semi-detached property – with 2-3 occupants. The average home comprises of a living room, kitchen, bathroom and 2 or 3 bedrooms. The average home tends to have been built from solid brick 220mm walls (instead of cavity walls), double or single glazing with modest loft insulation and some form of central heating system.
According to RIBA (The Case for Space: the size of England’s new home, Royal Institute of British Architects, September 2011) a survey of a sample of 3,418 homes across 71 sites concludes that an average three-bedroom home has a internal floor area of approximately 88m2.
Average energy cost for a home
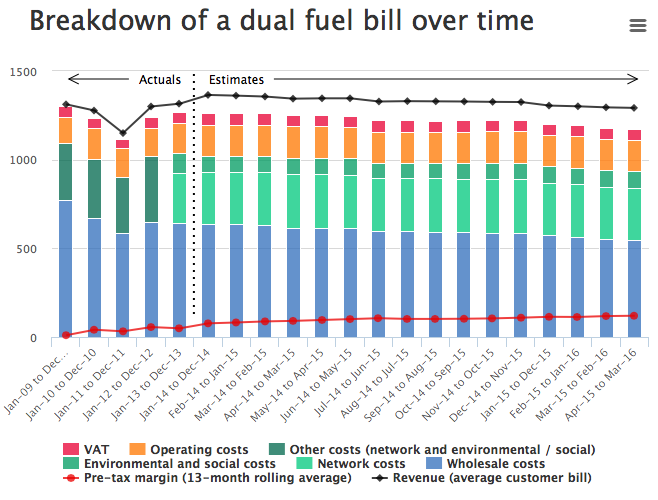
In the period between November 2014 and October 2015, the annual average dual fuel customer bill in the U.K. was £1,326 as can be seen in the table below (source: Ofgem). According to the Department of Energy & Climate Change (DECC), in 2014 the average domestic electricity consumption per UK household was 4,000kWh and the average domestic gas consumption per UK household was 12,400kWh.
As we mentioned, most people don’t fall into this average home. In order to make a more accurate estimation of the energy usage of your own home we need to take into account several different parameters – they are as follows:
- The type, size and age of your home
- The location and weather
- The heating and cooling type
- The levels of wall, floor and loft insulation
- The external wall area and windows area
- The efficiency of the appliances and lighting
- The occupancy
- The users’ status and lifestyle
In the next section we explore a little bit into the variables that determine the energy usage of a home. This will hopefully put into context some of the research published in this area and what we talked about at the top of the article.
The location and weather
To estimate the heating loads of a house we should take into account the difference between the inside and outside temperatures. So, the total heat losses of the house are therefore determined by the fabric and ventilation heat losses. The fabric heat losses can be calculated working out the surface of the exposed external walls and then calculating the u-values of each element. The ventilation losses depend on the cubic volume of each room and the air changes per hour through open windows and other forms of infiltration.
For example, the fabric heat loss coefficient of an average semi-detached 2-storey house of medium size (Total floor area: 98m2, Total window area 8m2 South and 8m2 North) can be given by the next equation:
cf = Σ UxA (W/K) where,
cf is the fabric heat loss coefficient,
Σ UxA is the sum of the products of the U-values and areas A of all parts of the external envelope of the building
| Length (m) | Width (m) | Area (m2) | Height of Ceiling(m2) | Volume(m3) | |
|---|---|---|---|---|---|
| 1st floor | 7 | 7 | 49 | 2.5 | 122.5 |
| 2nd floor | 7 | 7 | 49 | 2.5 | 122.5 |
| Total | 98 | 245 |
So, external wall area: 3sides x 7m length x 2floors x 2.5m height = 105m2
If we remove the area of windows the total external wall area will be: 105m2 – 16m2 =89m2
Given the typical U-values of such a house we will have the next table:
| Element | Area (m2) | U-value (W/m2/K) | A.U (W/K) |
|---|---|---|---|
| Wall | 89 | 0.45 | 40.1 |
| Windows (8m2 South, 8m2 North) | 16 | 2.50 | 40.0 |
| Floor | 49 | 0.45 | 22.1 |
| Roof | 49 | 0.25 | 12.3 |
| TOTAL | 203 | 114.5 |
The fabric heat loss coefficient is cf ≈ 115 W/K
The ventilation loss coefficient will be:
cv = (ac/h x Volume of building / 3) (W/K) where,
cv is the ventilation loss coefficient,
ac/h is the air changes per hour (0.8 ac/h for single-glazed windows and old frames)
The volume of house is: 49 x 5 = 245 m3
So, cv = 245 x 0.8 / 3 ≈ 65 W/K
To calculate annual space heat demands we have to add up daily heat demands over the whole of the space heating season. So, the annual space heat demand of a building is given by the next equation:
Annual space heat demand = (24/1000) x (cf + cv) x degree-days (kWh) where,
degree-days are the number of days when the average outside temperature is lower than a base temperature above which a building needs no heating.
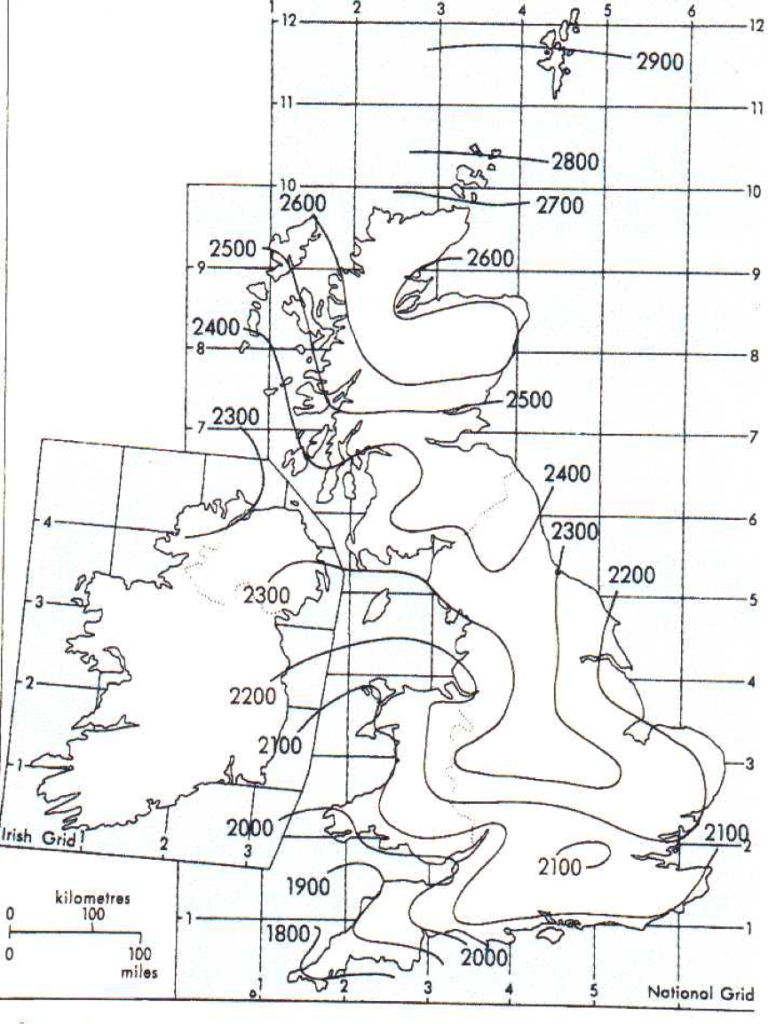
The degree-day figures normally assume a balance temperature or degree-day base temperature of 15.5°C. As can be seen in the next map, the value for London is approximately 2100 Degree days, for Newcastle 2400 and for Plymouth 1900. This figure is supposed to be representative of most dwellings, but for very well insulated dwellings and many commercial buildings it is too high, and leads to significant overestimates of annual space heat demand.
Figure 5: Degree Days map of UK based on 15.5°C
The next table shows the space heating demand for 3 different UK locations. Notice that this is the price for space heating only and not for the total gas consumption that comes from the hot water and cooking too.
| Degree-days | Annual space heat demand | Cost for heating | |
|---|---|---|---|
| Newcastle | 2,400 | 10,368 kWh | £363 |
| London | 2,100 | 9,072 kWh | £318 |
| Plymouth | 1,900 | 8,208 kWh | £287 |
* Gas unit price is taken as 3.50p/kWh
The space heating type
The main sources of heating are gas and electricity, but some homes are heated by oil and even biomass pellets. Most homes have condensing gas boilers and a typical seasonal efficiency on those units is approximately 87% over a heating season (for condensing boiler types), but you may well have an air source heat pump or a biomass boiler so the efficiencies will vary a huge amount. Non-condensing gas boilers have efficiency between 0.65 and 0.70. We will now use the gas boiler example to demonstrate how to calculate the useful heating required for your home.
To calculate the space heating required take the gas consumption for the home in kWhs (you can look at your annual gas bill statement) and then divide this figure by the average efficiency of your heating system.
For example, for an average house like we described previously located in London, to reach the required space heating demand of 9,072 kWh the energy consumption is:
- For a condensing boiler: 9,072 kWhs of gas/ 0.87 SPF = 10,428 kWh for this particular house, assuming continuous heating throughout the heating season (the six months around Christmas).
- For a non-condensing boiler: 9,072kWhs of gas/ 0.65 SPF = 13,957
| Type of Boiler | Required space heating (kWh) | Boiler efficiency | Energy consumption (kWh) |
|---|---|---|---|
| Condensing Boiler | 9,072 | 87% | 10,428 |
| Non-condensing Boiler | 9,072 | 65% | 13,957 |
| Save | 3,529 |
According to Sedbuk, the annual fuel costs for different boiler types is:
| Boiler Type | Flat | Semi-detached | Detached | Boiler Efficiency |
|---|---|---|---|---|
| Old gas heavy weight | £779 | £1204 | £1705 | 55% |
| Old gas light weight | £659 | £1019 | £1442 | 65% |
| New non-condensing | £549 | £849 | £1202 | 78% |
| New condensing | £481 | £744 | £1053 | 89% |
*These figures are based on a gas unit price of 4.36p per kWh (April 2013)
Quality of wall, floor and loft insulation
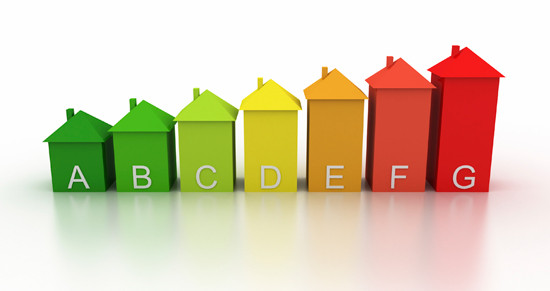
The average energy performance score (determined by the EPCs) of the UK is SAP60, which puts it into a band D. At SAP60 the insulation quality of a home can be described as moderate with areas that could certainly be improved. There are millions of homes though that have a far lower SAP energy score though – particularly homes built before 1930, when insulation quality wasn’t really a consideration.
Below we look at a home with some of the typical characteristics including the property fabric, quality of insulation and information on the heating system.
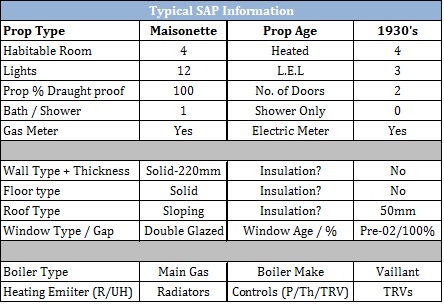
This is a typical semi-detached house with 4 habitable rooms, built between 1930 and 1949 with solid brick walls. There is no wall insulation and very little in the loft. The windows are double-glazed. The central heating system uses gas and the total area of a house is 100m2 and is occupied by 4 people.
This type of house would have the following kind of SAP information
We ran some numbers through the RDSAP calcualtion method, and the typical household energy bill for such a house is £1,576, 65% of this spent for electricity and 35% for gas. Given the prices for electricity and gas, 12.5p/kWh and 3.5p/kWh respectively, this house consumes 4,413kWh for electricity and 29,269kWh for gas per year.
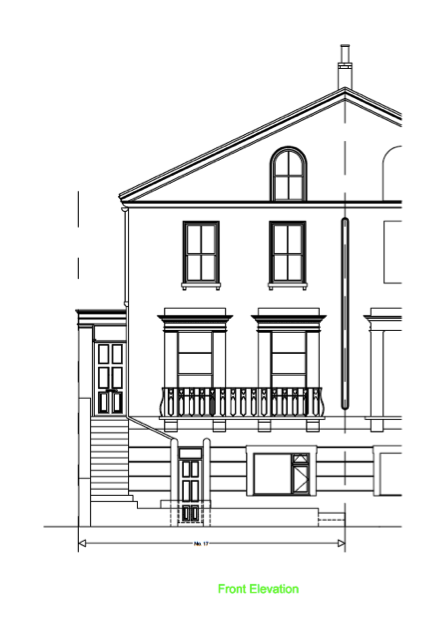
Figure 5: Façade of a common detached maisonette
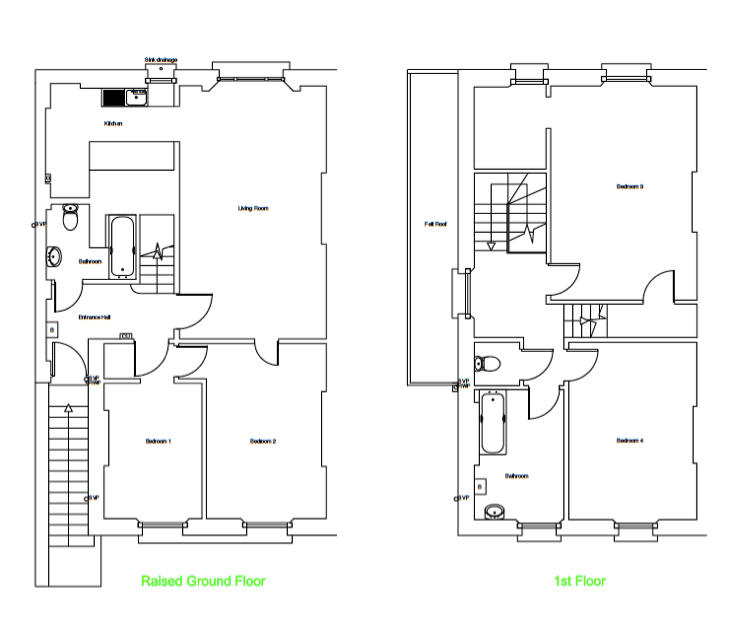
Figure 6: Floor plans of a common detached maisonette
The external wall area and windows area
The type of glazing and the frame type are responsible for the heat losses through the windows. Most of the UK houses have already replaced the old single-glazed windows and frames and they are now double-glazed. The ventilation and infiltration rate through the glazing and the frames is calculated given the volume of the house and the air changes per hour.
So, for an average UK house with double-glazed windows the air changes per hour are 0.8-1.0 and for double-glazed windows are 0.3.
| ACH | Ventilation loss coefficient cv | Required space heating (kWh) | |
|---|---|---|---|
| Single-glazing | 0.8 | 65 | 9,072 |
| Double-glazing | 0.3 | 24.5 | 7,031 |
| Save | 2,041 |
The efficiency of the appliances and lighting
A typical 3 bedroom semi-detached house has about 10 lights, each of them consuming 50W of electricity. So, each hour they spend 500W and the total energy for an average use of 4 hours per day is 2kWh. In the UK the cost of electricity is approximately 13p/kWh, therefore, the cost per day is £0.26 and the annual cost for 365 days is £95.0.
By replacing all of the incandescent light bulbs with LED lights the cost would be reduced to £9.5. So, you would have a reduction of 90% in your electricity consumption for lighting. Taking into account that lighting and home appliances tend to account for 20% of a typical energy bill this investment will save a significant amount of your money.
(See also 7 reasons why you should swap to LED lighting)
The occupancy
The heating and cooling loads of a home are influenced by the internal gains of the people who live at the house. At the same time, the more the occupants the more energy usage of the house appliances is being made.
The users’ status and lifestyle
Ofgem suggest the following for yearly energy consumption by user group:
| Low User (kWh) | Medium User (kWh) | High User (kWh) | |
|---|---|---|---|
| Electricity | 2000 | 3200 | 4900 |
| Gas | 9000 | 13500 | 19000 |
| Economy 7 | 2700 | 4600 | 7800 |
Table 2: Energy consumption of each energy user group according to Ofgem
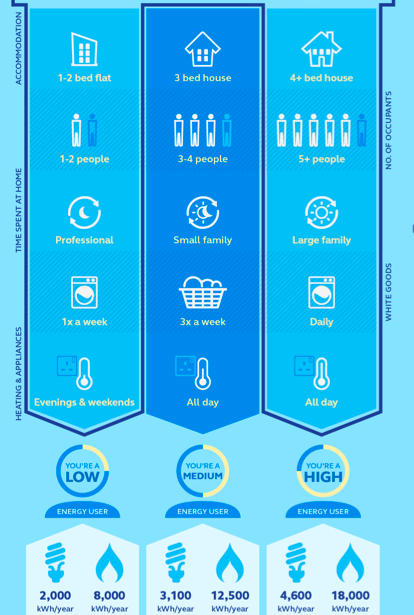
An average ‘medium user’ is defined in terms of energy use, as using 3,100 kWhs of electricity a year and 12,500kWhs of gas a year. As we stated previously, this kind of property describes a medium sized property, with three bedrooms occupied by 3 to 4 people (for example 2 adults, 2 children). During the day children are at school and parents at work, and everyone comes at home in the evening. They house appliances’ usage is a few times a week for the washing machine, regular heating, occasional dishwasher, TV and electrical appliances in the evenings, as can be seen in the next figure.
Figure 7: Three main categories of energy users according to Ofgem
To sum up, for different types of UK house the energy consumption is as follows, as calculated by using the Stroma RSAP program:
Type of House |
Age |
No Rooms |
No Storeys |
Size |
Area (m2) |
Electricity (kWh) |
Gas (kWh) |
Total Price (£) |
Mid Terrace |
1900-1929 |
3 | 2 | Small | 70 | 3760.4 | 24941.4 | 1343 |
| 4 | 2 | Medium | 93 | 4289.6 | 28451.4 | 1532 | ||
| 6 | 2 | Large | 116 | 4855.2 | 32202.9 | 1734 | ||
End terrace |
1900-1929 |
3 | 2 | Small | 70 | 4816 | 31942.9 | 1720 |
| 4 | 2 | Medium | 93 | 5311.6 | 35230.0 | 1897 | ||
| 6 | 2 | Large | 116 | 5838 | 38721.4 | 2085 | ||
Detached |
1983-1990 |
3 | 2 | Small | 80 | 3029.6 | 20094.3 | 1082 |
| 4 | 2 | Medium | 100 | 3472 | 23028.6 | 1240 | ||
| 6 | 2 | Large | 120 | 3911.6 | 25944.3 | 1397 | ||
Semi-Detached |
1930-1949 |
3 | 2 | Small | 80 | 3911.6 | 25944.3 | 1397 |
| 4 | 2 | Medium | 100 | 4412.8 | 29268.6 | 1576 | ||
| 6 | 2 | Large | 120 | 4916.8 | 32611.4 | 1756 | ||
Flat |
1967-1975 |
2 | 1 | Small | 40 | 2578.8 | 17104.3 | 921 |
| 3 | 1 | Medium | 60 | 3082.8 | 20447.1 | 1101 | ||
| 4 | 1 | Large | 80 | 3626 | 24050.0 | 1295 |
Table 3: Annual consumption for different house types
You can save money from your energy bills by either reducing your existing energy demand or using renewable energy, or with a combination of them. Applying one or more of the next methods in your property can reduce the domestic energy consumption:
- Wall and loft Insulation
- Double glazing
- Draught proofing
- More efficient boiler
- More efficient light bulbs
- Low consumption house appliances
- Thermostats
- Home automation systems
The Renewable energy systems include:
- Solar Pvs or Solar thermal
- Biomass
- heat pumps


This is very useful. Seems my home uses way more energy than the average home! Just made the switch to LED lights and already my electricity bills are down!
is 3 in cv = (ac/h x Volume of building / 3) the specific heat cpacity of air
There is an error in one of the tables- efficiency of both condensing and non-condensing are given as 87%
Hi Mike, thanks for pointing that one out! We’ve updated that typo.
Many thanks,
Harriet
I have had LED lights for several years, my yearly energy cost for lights is £12 per year
I thought it would be interesting to calculate the effect if every household converted to LED lights, all 25million homes.
The result.
1. co2 emission reduced by 8Million tonnes per year. (gas fired power station)
2. Electricity bills reduced by £2.2 billion per year.
3. Energy saved 14Terawatt/hrs.
4. Peak power demand on the grid reduction 13Gigawatts (in hours of darkness) same as 3 hinkley point power stations.
The new “filament” type LEDS (with no down converters) are so cheap now that the payback time in saved energy is only 10 weeks at 4 hours use per day.
Would it not be a good idea for the Government to encourage/advertise/educate and subsidise every houshold to change?
By comparison that is 3 hinkley point power stations for a knock down price of £500Million.
I would love this to be true, absolutely love it. Unfortunately, however, I believe that you have based this on one or two incorrect assumptions. Incidentally, I only disagree with your numbers, not the ideal of a massive energy reduction and certaily would love to see the UK Gov giving incentives to convert.
Firstly, I beleive that not all of the 25 million households are still using exclusively incandescent bulbs (high energy bulbs, if you like). I’d be surprised if even 10% of them still do.
Secondly, if your calculations were based on the statement in this article that you could save 2kWh per day on lighting, I have to take issue with that too. Nobody leaves all 10 lights on for 4 hours per day. No, I didn’t ask them all, but come on? The EST says £3 per bulb annual saving, so maybe 30-40% of this articles claims.
So I’m claiming that your estimated savings are maybe 20-30 times too large.
Now, one thng that I really liked is the way you express these potential savings in “Hinkley” units – very good.
One wonders if, by spending let’s say 10% of the Hinkley cost, the Government could educate and subsidise enough on smarter ways to reduce energy consumption, that the need for a new Hinkley would be completely obviated. Ah, well … just off to feed the flying pigs!
I’m very disappointed by your claim of how much one might save by converting to energy saving bulbs. I don’t think anyone will have all 10 bulbs on for 4 hours per day, which is what it would take to acheive thse savings. It’s probably half of this value or a lot less, as suggested by the EST.
Great Page. Love the detail on space heating – but I couldn’t see reference to domestic hot water energy demand. Did I miss this?
Hi thanks for posting,
Please can you explain this sum “Annual space heat demand = (24/1000) x (cf + cv) x degree-days (kWh)”
I don’t follow where the (24/1000) figures are from?
Thanks
Selling real estate fast is an interesting option for those in tight spots